Performance Comparison Analysis
Eq Asset(5 stk filter) vs. Q Asset(NDX 100 Index) | Growth of $1,000 Initial Investment
as of April 24, 2026
Executive Summary
This report evaluates the performance of the Eq Asset and Q Asset. By utilizing logarithmic scaling and period-based performance metrics, we identify the superior compounding efficiency of the Eq Asset over the long term.
Total Returns (Trailing)
| Investment Period | Eq Asset Return (%) | Q Asset Return (%) |
|---|---|---|
| 1 Week | 8.12% | 2.35% |
| 1 Month | 34.76% | 12.97% |
| 6 Months | 95.15% | 7.56% |
| 1 Year | 202.64% | 42.00% |
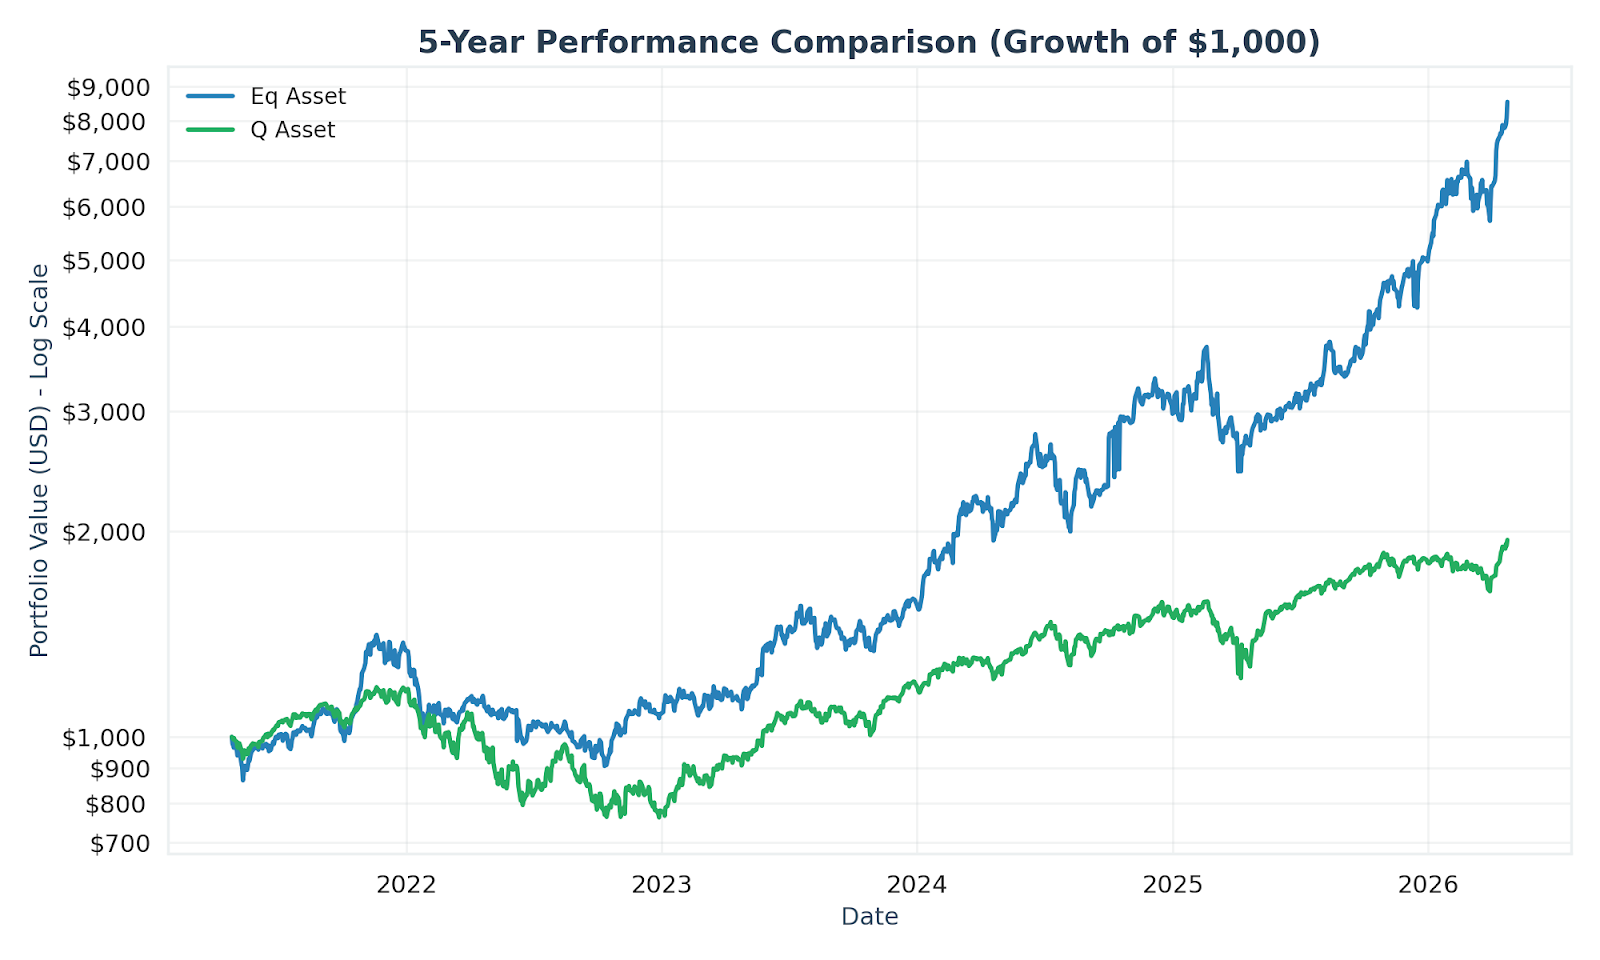
| 5 Years | 764.77% | 95.78% |
| 10 Years | 10,362.38% | 511.49% |
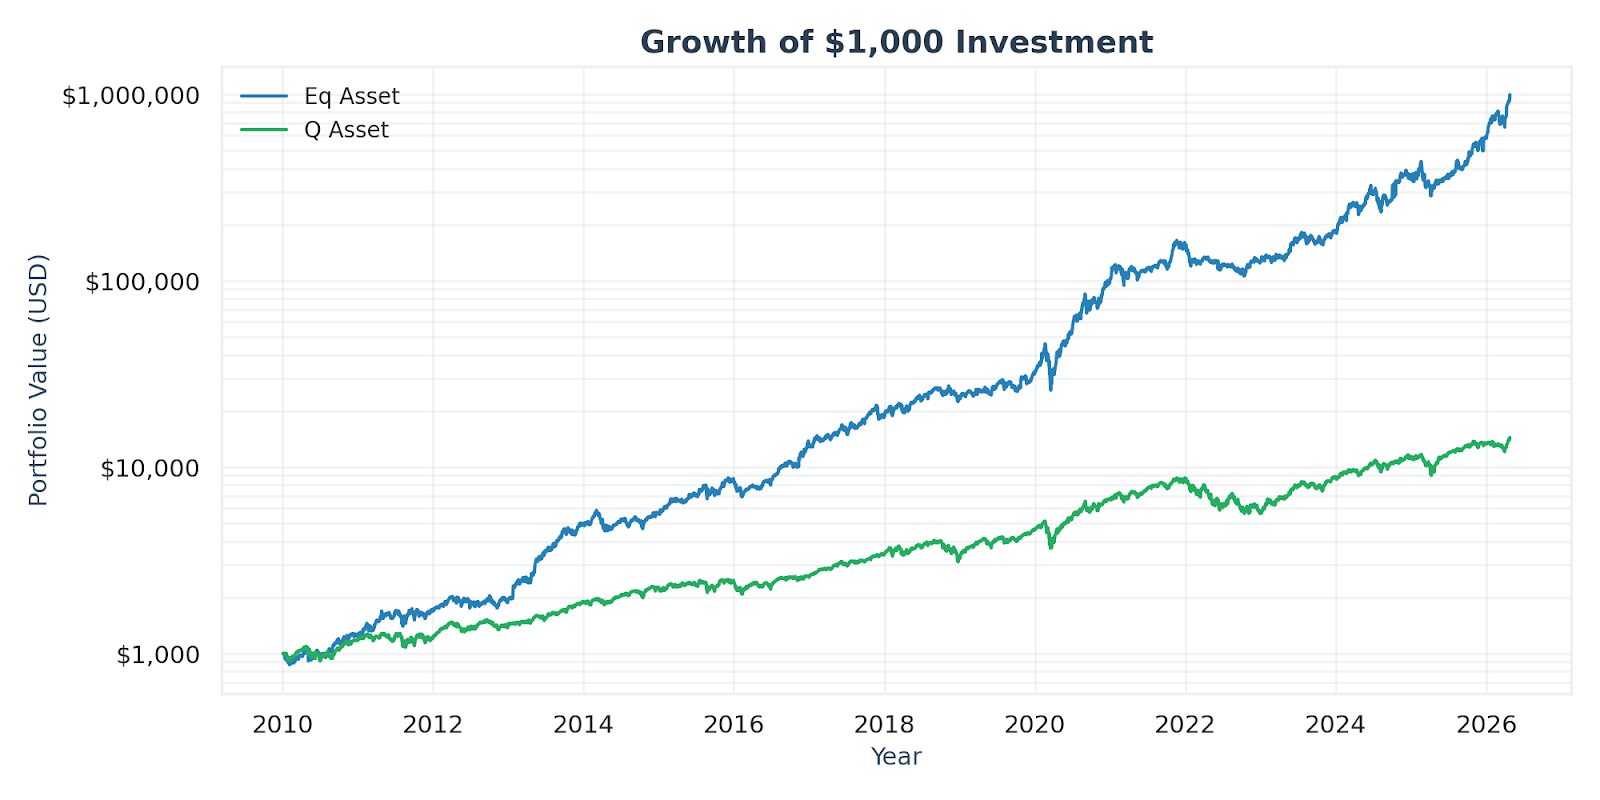
Historical Growth (Logarithmic Scale)
Calendar Year Returns
| Year | Eq Asset Return (%) | Q Asset Return (%) |
|---|---|---|
| 2026 (YTD) | 64.92% | 8.29% |
| 2025 | 66.70% | 20.47% |
| 2024 | 92.44% | 27.10% |
| 2023 | 45.91% | 54.90% |
| 2022 | -19.08% | -33.72% |
| 2021 | 51.42% | 28.70% |
| 2020 | 212.63% | 45.09% |
| 2019 | 32.35% | 37.31% |
| 2018 | 27.70% | -2.62% |
| 2017 | 43.08% | 30.12% |
5-Year Performance Focus
Strategic Insights
- Compounding Alpha: An initial $1,000 investment in the Eq Asset 10 years ago would have scaled to over $103,000, significantly outperforming the index.
- Resilience in Volatility: Although the Eq Asset is more volatile, its logarithmic trajectory shows consistent recovery and higher growth floors over a 16-year period.
- Year-over-Year Success: The Eq Asset outperformed the Q Asset in 8 of the last 10 calendar years.
- Trade Metrics
- Historical Trades
Disclaimer: This report is for informational purposes only. Historical performance is not indicative of future results.