CONTRIBUTION TO GAINS
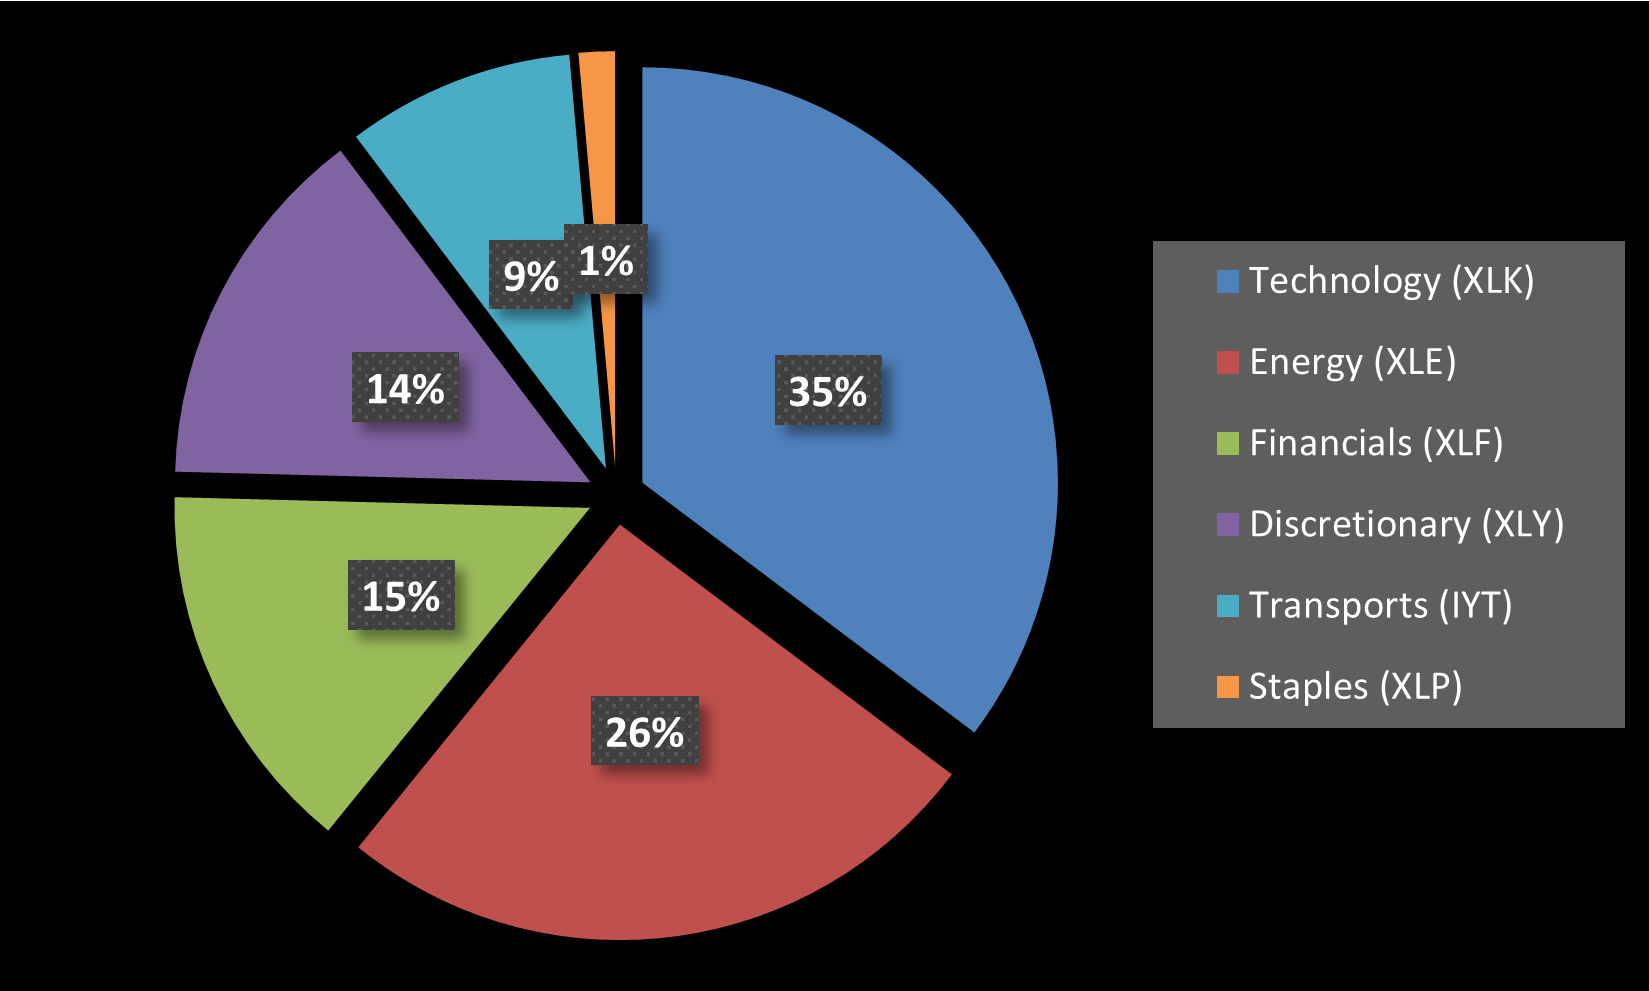
2005 - 2024ytd
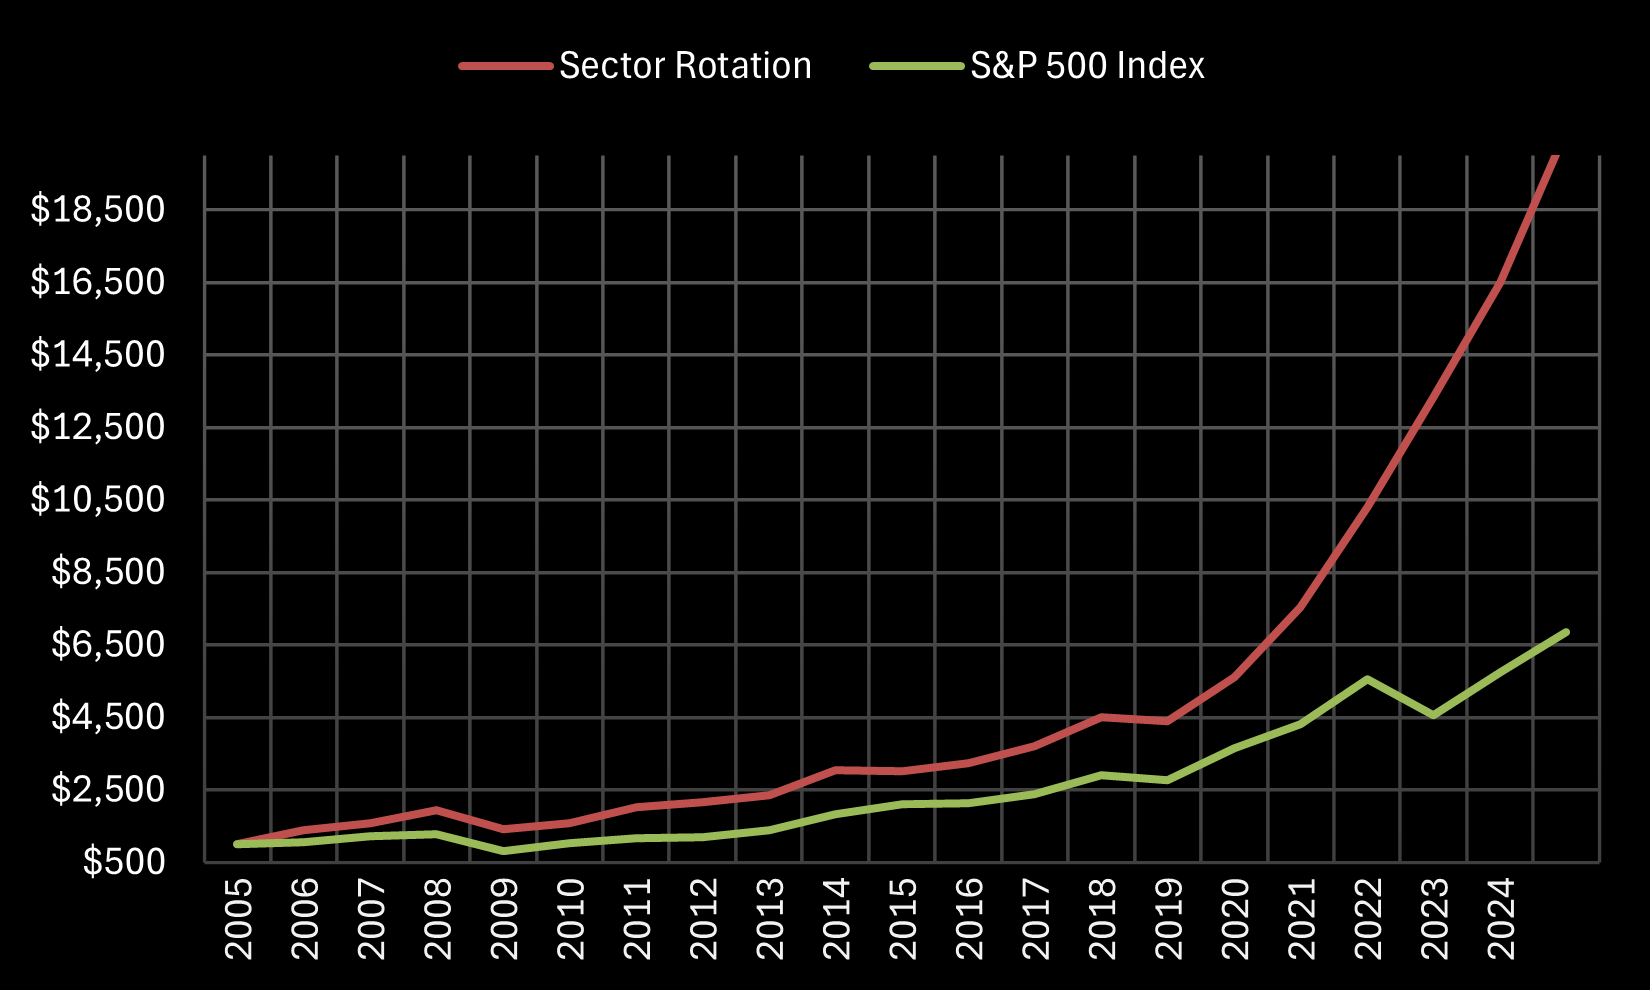
HOLDING VS ROTATION
COMPOUND ANNUAL RETURN (CAR)
| SECTOR | INVESTED THE ENTIRE TIME | ONLY DURING ROTATION PERIODS |
| ENERGY (XLE) | 7.4% | 17.6% |
| FINANCIALS (XLF) | 5.1% | 29.1% |
| TECHNOLOGY (XLK) | 14.0% | 25.5% |
| STAPLES (XLP) | 9.3% | 2.7% |
| TRANSPORTATION (IYT) | 8.7% | 14.8% |
| DISCRETIONARY (XLY) | 10.2% | 18.7% |
| S&P 500 Index | 10.4% | N/A |